Calculating the Collective Effect: Stemming the Tide of Climate Change
Spring
2020
Physics Puzzler
Calculating the Collective Effect: Stemming the Tide of Climate Change
Terance Schuh, SPS 2019 Summer Intern, and Brad Conrad, Director of SPS & Sigma Pi Sigma
At this point just about everyone has heard about climate change to some extent. Whether it’s through politics, social media, science, or simply at the dinner table, it seems you’d need to be extraterrestrial beings to not have heard of the changing climate on Earth. Truthfully, it is a global, human crisis, and it requires a global and human set of solutions. However, something that we’ve wondered for a long time is who exactly are the people working on these solutions? What are their educational backgrounds? Where do I go and what should I do if I want to work in the field? What kind of science is climate science?
Unfortunately, the answers to those questions are not as cut and dry as some might hope. Climate scientists have wildly diverse backgrounds, and there are many different types of research that fall into the field known as climate science. What we can tell you is that studying physics is one of the best gateways to preparing yourself to study climate change and solve hard-pressing questions society is literally dying to address. If you’re reading this article, there is a strong chance you’re already passing through that gateway, so you’re well on your way to thinking critically about solutions to the climate crisis.
The skills we learn through physics are invaluable for anyone studying how the climate is changing and how we might be able to stem the tide of this crisis. While the problem is inherently interdisciplinary, physics is the backbone of climate science and potential solutions. Consider it this way: Physics is the study of the universe and how natural mechanisms behave. The Earth is a heavenly body with unique, yet predictable characteristics. It orbits the sun, rotates on an axis, and has the capability of absorbing and transmitting thermal radiation. All of these factors contribute to its ability to sustain intelligent life such as us. At the same time, they also drive the weather and climate. The Earth’s climate is a natural and complex mechanism that is based on physics principles.
Therefore, as physicists we should desire to study climate behavior and make predictions about how it changes. This includes how it changes both naturally and due to decades of human behavior, such as heavy coal burning, as a stimulus. The climate really is just another branch of physics, and climate change is one big physics problem. We need to present scientifically rigorous solutions to the rest of humanity so we can create a sustainable, inhabited Earth that can thrive for many more eons.
In this puzzler we use a physicist’s approach to answer some neat climate-related problems. Interestingly, their answers show you how physics is vital in interdisciplinary studies such as climate change.

If we stopped driving cars, would that solve the climate crisis?
To be more specific, we’re asking you to work out what would happen if everyone around the world stopped driving fossil fuel–powered private vehicles. How would it affect the current climate crisis? This question allows for a lot of interpretation, as there are different ways to estimate important quantities.1–5 Additionally, this is a very personal question—people have connections to their cars. Car culture is a tradition in many countries, and the availability of quick and cheap transportation over long distances is now seen as mandatory for modern life. Driving might not be the largest source of global CO2 emissions, but often people want to make a direct impact, and auto emissions are one of the most easily observable sources of CO2 emissions. For the sake of this problem, let’s focus specifically on the reduction of CO2 emissions and ignore other transportation sources.
We’ll start with some basic assumptions (that are backed up by recent statistics):
• With a global population of over 7 billion people, we’ll estimate there are at least 1 billion working automobiles, globally.
• The average person drives 30 miles a day.
• The average automobile on the road today gets 22 miles per gallon of gas.
• One gallon of gas creates 19.6 lbs of CO2 emissions.
Right away we see that since 1 gallon of gas creates 19.6 lbs of CO2 and the average vehicle on the road has a fuel efficiency of 22 miles per gallon, every 22 miles of driving creates 19.6 lbs of CO2. Since the average person drives 30 miles a day and not 22 miles, we then have to calculate how much CO2 each person is emitting into the atmosphere solely from driving.
(22 Miles)/(19.6 lbs of CO2 )≅(30 Miles)/(26.7 lbs of CO2 )
Therefore, each person generates an average of 26.7 lbs worth of CO2 emissions daily.
Of course, not everyone in the world drives. However, we assumed there are approximately 1 billion cars in the world right now. Even if that assumption is on the lower end of approximations, it is partially balanced by the fact that not every car is driven every day. Since each car produces 26.7 lbs of CO2 emissions each day, 1 billion cars will produce about 3×10¹⁰ lbs of CO2 emissions, and that’s solely from private vehicles! Putting it in different terms, humans are emitting a staggering 1.3×10⁷ tons of CO2 into the atmosphere each day simply from driving private vehicles! It’s also important to note that this number does not include the daily emissions from other forms of transportation such as airplanes, trains, and boats, but you can imagine that they would only enhance the issue.
As physicists, we know that numbers mean nothing without a frame of reference, so let’s figure out how this number relates to our global daily CO2 emissions using recent statistics6-10:
• Global, annual CO2 emissions = 40 × 109 tons
• Global, daily CO2 emissions = 0.11 × 10⁹ tons
From this, we can calculate what percentage our number corresponds to in the grand scheme of things:
(1.3×10⁷ tons of CO2 per day worldwide from driving)/(1.1 × 108 tons of CO2 per day worldwide)≅12%
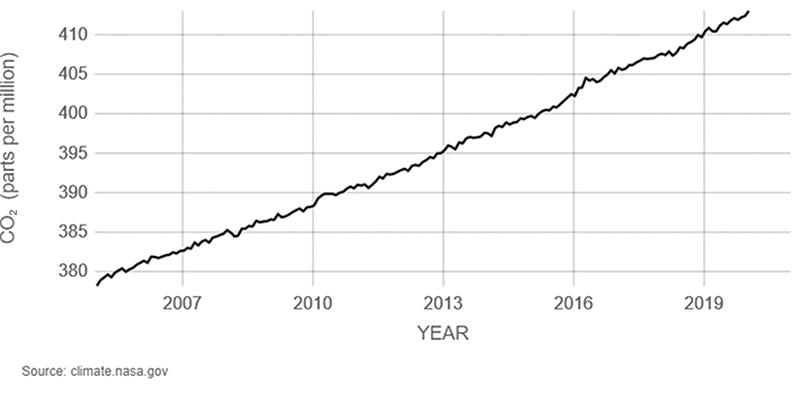
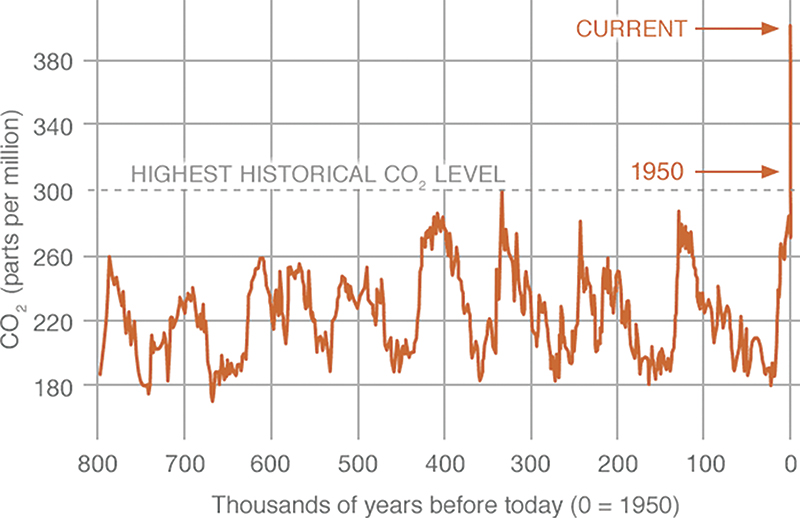
This means that cars are contributing ~12% of total CO2 emissions. The US Environmental Protection Agency (EPA) estimates that all sources of transportation in the United States6 are responsible for ~30% of the total US emissions. A little more than half of transportation pollution is caused by cars,11 so our estimate is pretty good. But what does that mean in terms of climate change? First of all, it means that if we all stopped driving cars tomorrow and continued doing so indefinitely, we could reduce the new CO2 being put in the atmosphere by one-eighth. And while the earth does absorb and process some CO2 each year,6 human-made carbon emissions are rising.7 We can see this from CO2 concentration measurements as a function of year in Fig. 1 from NASA. Figure 1 shows an increasing CO2 trend, and when compared with the historical data of the past few hundred years, as seen in Fig. 2, the trend is not just striking but deeply concerning. So although giving up driving personal vehicles would stunt the climate crisis, we need to do more: develop carbon neutral methods of traveling, limit other sources of CO2 , and reduce dependence on carbon-heavy forms of energy. In other words, collectively not driving would significantly slow our annual CO2 emissions in the short term, but maybe the long-term solution is to remove CO2 from the atmosphere . . .


What if everyone on the planet planted a tree?
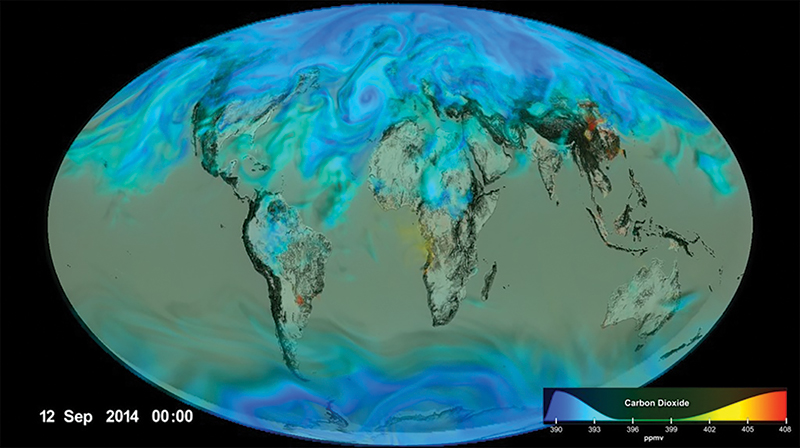
As kids we thought about this question a lot, as we learned that trees “breathe” in CO2 and breathe out O2—they are figurative carbon sponges. And we firmly thought that if we could just plant enough trees, we could store enough CO2 to stop global warming. Some have worked on this before.12 We can see from Fig. 2 that a level of 300 parts per million CO2 is the historical average for recent history, and we are currently well above 400 ppm CO2.12,13 From that curve we can estimate a rough increase of 2 ppm per year. To absorb just the increase in atmospheric CO2, we’d need to capture more, ~20 billion tons of CO2 per year using trees. Figure 3 shows us some data visualizations using the Orbiting Carbon Observatory (OCO-2). Are trees up to the task?
Let’s assume we can get each person in the world a tree instantaneously, with no energy or CO2 cost. Furthermore, let’s assume they plant a small seedling and the tree grows to a large size. Let’s pick a pine tree, as they tend to have long, straight trunks, and find its volume—some species of pine tree can grow well over 60 feet. Let’s consider only the amount of material in the trunk; this neglects the mass of the limbs (and of all the needles they produce), but they are less effective at storing carbon. If we treat the trunk as a cone of 18 m height and a diameter of 1 m, we know from geometry that the volume of wood Vwood should be
Vwood=π ∙ radius2 ∙ height/3,
and plugging in our estimates, we arrive at 5 m3 of wood per tree per person. So if all 7 billion people planted a tree, we’d have (5 m3 of wood)·(7×10⁹)=3.5×10¹⁰ m3 of wood. If the density of wood is about 750 kg/m3, we end up with 3.5×10¹⁰ m3 of wood · 750 kg/m3=2.6×1013 kg of wood. While wood is made of elements other than carbon, it’s also porous, leaving lots of empty space and water inside. So let’s assume that wood is ~1/3 carbon. This gives us about 8.8×10¹² kg of carbon, or about 1×10¹⁰ tons of carbon. But this is the total wood after about 30 years of growth! So we are capturing about 3.2×10⁸ tons of carbon per year. Thinking back fondly on our chemistry courses, the molecular weight of CO2 is ~44 g/mol (12 g/mol for carbon, and 2×16 g/mol for oxygen). Consequently, CO2 is 27% carbon by weight. Assuming that all the tree’s carbon comes from CO2, we are actually removing ~1.2×10⁹ tons of CO2 each year!
Comparing to our estimate of 1.2×10¹⁰ tons of CO2 that is currently being added to the atmosphere each year, this won’t be enough. But if we planted a tree each year, after 10 years we’d be capturing 1.2×10¹⁰ tons of CO2 each year. This means that if everyone planted a tree each year, we could roughly remove the same amount of CO2 we are adding to the atmosphere and stop the increase in atmospheric CO2!
Now, the issue is what to do with the wood once it’s grown. If we let nature take its course, the trees will eventually die and then rot, thereby releasing the carbon back into the environment. We want to stop the process and capture the carbon indefinitely, so we could cut the trees down, dry them, and stack them in a warehouse. Or we could bury them in such a way that they would not decay. The key is to capture the carbon before it makes its way back into the atmosphere.
From here, we leave the following climate crisis puzzler to the reader: If we have about 420 ppm of CO2 in the atmosphere and the atmosphere is roughly 5×10¹⁸ kg, we have about 3.6×10¹² tons of carbon dioxide in the atmosphere as of 2020. Based on the figures and statistics provided,10–13 how many years in a row would all of humanity need to plant two trees to bring the CO2 levels back to the 300 ppm level? How much area would that take as a percentage of the earth? Could we even store that much carbon/wood, or could we just make new forests? How long if we each planted a tree AND stopped driving cars?
Challenge questions: If everyone gave up eating meat, how would that impact the climate situation? Can you think of another scenario in which a single behavioral change would address the magnitude of this problem? Did we make a mistake in this puzzler? Let us know any and everything by emailing sps [at] aip.org.
References:
1. greenismything.com/2015/09/16/what-if-everyone-in-the-u-s-stopped-driving-for-one-day/.
2. www.worldometers.info/cars/.
3. nj1015.com/how-many-miles-do-you-drive-each-day/.
4. www.epa.gov/greenvehicles/greenhouse-gas-emissions-typical-passenger-vehicle.
5. blogs.ei.columbia.edu/2017/03/10/the-science-of-carbon-dioxide-and-climate/.
6. climate.nasa.gov/news/2915/the-atmosphere-getting-a-handle-on-carbon-dioxide/.
7. slate.com/technology/2014/08/atmospheric-co2-humans-put-40-billion-tons-into- the-air-annually.html.
8. www.newscientist.com/article/2191881-carbon-dioxide-levels-will-soar-past-the- 410-ppm-milestone-in-2019/.
9. www.c2es.org/content/international-emissions/.
10. www.atag.org/facts-figures.html.
11. www.europarl.europa.eu/news/en/headlines/society/20190313STO31218/co2-emissions-from-cars-facts-and-figures-infographics.
12. www.wired.com/story/plant-a-tree-for-climate-change.
13. en.wikipedia.org/wiki/Atmosphere_of_Earth#Pressure_and_thickness.
